
Powered by American Jobs
Examining Charter's Nationwide Impact
Oxford Economics examined Charter’s operations and activity to calculate the impact of the company’s investments nationally and at the state-level.
July 13, 2018
Share Article:
Oxford Economics’ Key Findings
Charter’s investments in its people, infrastructure, and operations create significant economic impact in all 50 states.
Charter’s Nationwide Economic Impact

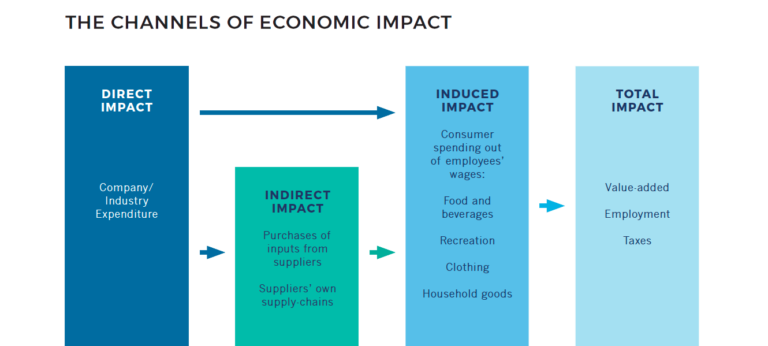
Contributes $48 Billion to GDP
When all three channels of activity are considered (direct, indirect, and induced), Charter supports over $48 billion in economic activity (GDP), and $30 billion in income each year – and its productive workforce drives an output of $438,000 per worker.
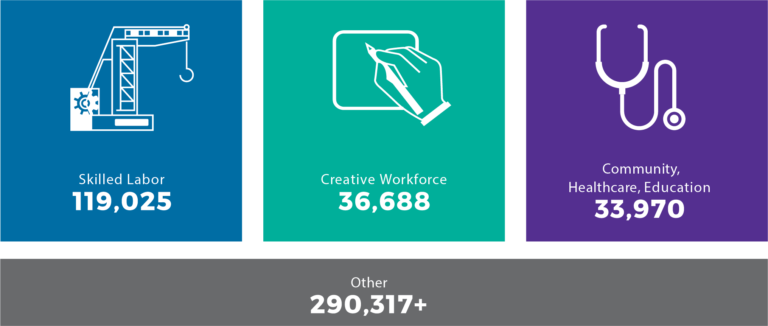
Supports over 480,000 Jobs
Oxford Economics estimates that Charter supports over 480,000 jobs, including 94,000 directly employed workers in the United States, having added more than 22,000 employees to its U.S. based workforce since 2012.
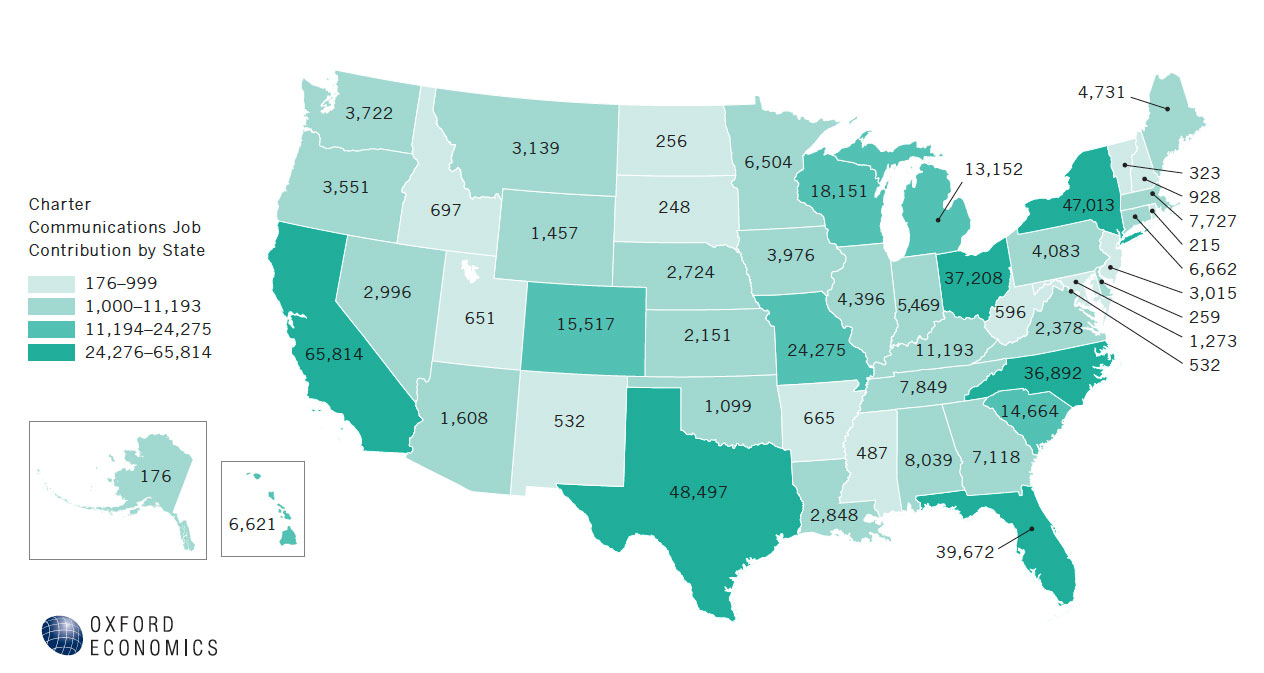
Impact in All 50 States
Economic Impact in Action

A Commitment to Veterans
Helping veterans translate their talents to a meaningful and viable civilian career.

Connecting the Nation
Expanding access to high-speed broadband in the communities it serves.

Charter in the Community
Opening our first fully bilingual call center in McAllen, Texas.

Providing Culturally Diverse Programming
Bringing high-speed internet service to communities throughout New York.

Investing in the Next-Generation of Connectivity
Adopting new technologies to provide the most innovative products.
Commitment to New York State
Bringing high-speed internet service to communities throughout New York.
Footnotes:
* All data shown in tables and charts are Oxford Economics’ own data, except where otherwise stated and cited in footnotes, and are copyright © Oxford Economics Ltd.